- Interactive Video Examples Comparison
- Understanding What Video Marketing Analytics Really Means
- Building Your Video Analytics Foundation From Scratch
- Focusing On Metrics That Actually Drive Growth
- Advanced Analytics Techniques That Transform Performance
- Creating Reports That Actually Get Read and Acted Upon
- Scaling Video Analytics Across Multiple Campaigns
- Your Video Analytics Implementation Roadmap
Understanding What Video Marketing Analytics Really Means
Let’s be honest: the term "analytics" can feel like you're about to stare at a wall of confusing charts and numbers. At its heart, though, video marketing analytics is just about listening to what your customers are telling you with their viewing habits. It’s about getting past vanity metrics like total views and finding the data that tells a real story about your brand's impact. For a Shopify store, this means figuring out how a product video actually leads to sales, not just how many people clicked play.
Focusing on Actionable Data
Instead of chasing a high view count, the most successful merchants I've seen focus on genuine engagement. A video with 1,000 views and a 90% completion rate is way more valuable than one with 10,000 views where everyone leaves after three seconds. This is where the real insights are hiding.
Think about these key metrics that show you what viewers are actually interested in:
- Audience Retention: This graph shows you the exact moments people lose interest and click away. If you see a big drop right when your call-to-action (CTA) appears, you know it needs a rethink.
- Click-Through Rate (CTR): This tells you how many viewers clicked your "Shop Now" link. It’s a direct connection between someone watching your video and landing on your store.
- Conversion Rate: This is the ultimate metric. How many of the viewers who clicked through ended up buying something? This directly ties your video efforts to your revenue.
Why This Shift in Focus Matters
The data backs up this focus on meaningful metrics. By 2025, a massive 89% of companies are expected to use video in their marketing. Even more telling is that 95% of video marketers now consider it a critical part of their strategy, which shows a deeper understanding of its effectiveness beyond just view counts. You can find more insights on the evolution of video marketing in Wyzowl's latest report.
This mindset is especially important for small businesses where every marketing dollar has to work hard. To get a better handle on this, looking into general ecommerce data analytics can give you a strong foundation for your entire strategy. If you're looking for more specific tips, you might find our guide on video marketing for small business helpful.
Building Your Video Analytics Foundation From Scratch
Diving into video marketing analytics can feel like a huge task, but getting the foundation right is essential for figuring out what's actually working. The real aim isn't just to pile up data; it's to collect the right information that helps you make smarter choices and ultimately drive more sales for your Shopify store. Let's walk through the fundamentals.
Defining Your Tracking System
Before you even glance at a dashboard, you need to decide what a "win" looks like for your videos. Is it a direct product purchase? A newsletter sign-up? Or maybe just getting a potential customer to watch a full product demo? Your goals will shape every other decision you make. I've seen many merchants skip this part and end up chasing vanity metrics that don't actually affect their revenue.
A great first step is to use UTM parameters for every single video campaign. Think of them as custom tracking tags you add to your URLs. For instance, a link you put in a YouTube video description could have utm_source=youtube and utm_campaign=spring-launch-video. This small addition tells Google Analytics exactly where that visitor came from, showing you which videos are successfully bringing people to your store and leading to sales. Without UTMs, all that valuable traffic gets bundled into "direct" or "referral," leaving you completely in the dark.
The infographic below shows how you can organize key data points on a dashboard to measure success effectively.

This visual demonstrates how tracking specific video plays and user interactions can be arranged to deliver clear, useful insights quickly.
Connecting Your Platforms for a Cohesive View
Once your goals and tracking methods are set, it's time to link your tools. To get the full story, your Shopify analytics, Google Analytics 4 (GA4), and your video hosting platform (like YouTube or Vimeo) need to communicate with each other.
Inside GA4, you can create custom events to monitor specific video interactions, such as "video_start" or "video_completion." This creates a complete view of the customer's path, from the moment they press play on a video to when they complete a purchase. Remember, great tracking starts with well-thought-out content. For tips on making videos that are easier to analyze, take a look at our guide on ecommerce video production. By connecting these platforms, you stop looking at isolated data points and start seeing the story of your customer's behavior.
Focusing On Metrics That Actually Drive Growth
Not all data is created equal. In the world of video marketing analytics, it's easy to get sidetracked by vanity metrics that look impressive but don't actually move the needle for your Shopify store. Many merchants get caught up in chasing view counts, but a high number of views means very little if no one is actually watching or taking action. The real goal is to cut through the noise and identify the numbers that consistently lead to business growth.

Beyond the View Count: What Really Matters
Instead of simply asking, "How many people saw my video?" a much better question is, "How did they behave while watching?" This shift in perspective is what separates successful video marketers from the rest. It’s about understanding engagement, not just reach.
Here are the core metrics you should prioritize:
- Video Completion Rate: This tells you the percentage of viewers who watched your video from start to finish. A high completion rate is a fantastic indicator that your content is genuinely engaging. It means you held your audience's attention, making them more likely to absorb your message and respond to your call-to-action.
- Video-Influenced Conversions: This is a game-changer for any e-commerce store. It tracks how many customers watched a video at some point before making a purchase. They might not have clicked the "Buy Now" button directly from the video, but its influence was a critical touchpoint in their journey to checkout.
Calculating a Meaningful Video ROI
Ultimately, your team and any stakeholders want to see one thing: a solid return on investment (ROI). Proving that your video efforts are paying off is crucial. The good news is that the evidence is overwhelmingly positive. Recent studies show 93% of marketers report a positive ROI from their video efforts.
This success isn't just a feeling; it translates to the bottom line, as 84% directly attribute increased sales to their video initiatives. You can dig deeper into these numbers in HubSpot's latest marketing statistics report.
Fine-tuning your strategy also means paying attention to platform-specific behaviors. For instance, knowing the best times to post on TikTok can give your engagement a serious boost right from the start, which directly impacts these more meaningful, growth-oriented metrics.
Advanced Analytics Techniques That Transform Performance
Once you've got a handle on the basic numbers, it's time to dig into the more powerful video marketing analytics that show you what truly makes your audience tick. These advanced methods go beyond surface-level data, helping you make smarter, more profitable decisions for your Shopify store. It's like moving from just reading the game's final score to analyzing the actual playbook.
Pinpointing Viewer Behavior with Heatmaps
One of the most eye-opening tools in your arsenal is the video heatmap. Instead of a simple retention graph, a heatmap visually shows you which parts of your video people are re-watching, skipping, or pausing on. Imagine you notice a big spike in re-watches right when you're showing a specific product feature. That's not a coincidence.
This tells you that particular feature is highly compelling. You should probably create more content about it or even make it the star of your next ad campaign. It's no surprise that 28% of marketers are already using engagement graphs and heatmaps to get a leg up. This kind of detailed feedback is pure gold for refining your video content.
Optimizing Through A/B Testing
Guessing is the enemy of a high-performing video strategy. A/B testing is your secret weapon for making data-driven improvements. But don't just test one completely different video against another; get specific with your tests.
- Test your thumbnails: Does a thumbnail showing a smiling person using your product outperform one that just shows the product on a white background?
- Experiment with titles: Try framing your title as a question versus a direct statement. For example, "Will This Gadget Change Your Morning Routine?" vs. "The Gadget That Improves Your Morning Routine."
- Vary your calls-to-action (CTAs): See what happens when you test different button text ("Shop Now" vs. "Learn More"), change the button color, or adjust when the CTA appears in the video.
Sometimes a tiny change, like swapping a thumbnail, can send your click-through rate soaring. By testing these individual elements, you can systematically improve your video's results rather than just crossing your fingers and hoping for the best.
To help you prioritize your efforts, here’s a quick checklist of optimization tactics you can try, ranked by their potential impact and how difficult they are to implement.
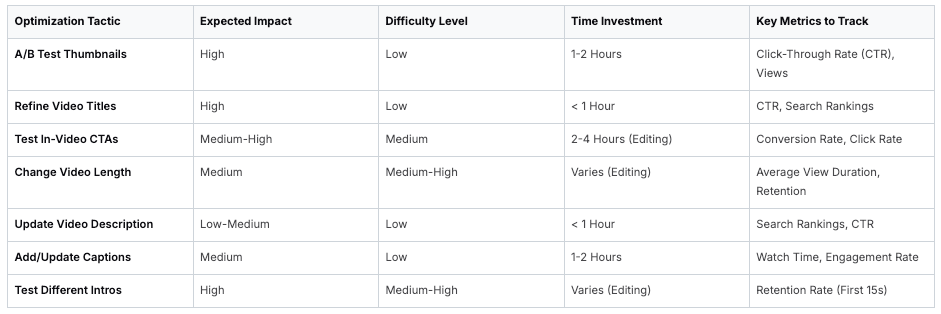
This checklist shows that you don't always have to reshoot an entire video to see better results. Simple, low-effort changes like testing thumbnails and titles can have a massive impact on your key metrics.
Segmenting Your Audience for Personalization
Finally, stop thinking of your audience as one big, uniform crowd. Your analytics platform is a goldmine for segmenting viewers based on their behavior. For instance, you could create a specific audience segment of everyone who watched more than 75% of a detailed product demo video but never made a purchase.
This group is clearly interested but something held them back. You can now retarget these specific viewers with a tailored ad campaign. Maybe you send them a follow-up video that tackles common objections or a small discount to nudge them over the finish line. This level of personalization shows customers you're paying attention and can seriously boost your conversion rates.
Creating Reports That Actually Get Read and Acted Upon
Raw data from your video marketing analytics is just a pile of numbers until you shape it into a compelling story. A great report doesn't just present data; it persuades stakeholders and drives smart decisions. Too often, analytics reports are filed away and forgotten. A few key changes can ensure yours gets the attention it deserves and, more importantly, inspires action.

This kind of visualization is critical. It helps you turn complex video metrics into a simple, easy-to-understand narrative that connects directly to your business goals.
Storytelling with Data
Instead of just listing metrics, frame your report around a narrative. Start with the "what"—the key results like view count or engagement rate. Then, dive into the "why"—the insights explaining those results. For instance, you could say, "Our new product demo video had a 75% completion rate, which is 20% higher than our previous videos. We believe this is because we focused on the top three customer questions from our support team." This approach connects the dots for everyone involved.
Focus on What Matters to Your Audience
Tailor your report to who's reading it. Your marketing team needs granular details like click-through rates and audience retention, while your CEO probably just wants the bottom-line ROI. For executives, create a one-page summary that highlights the most critical outcomes, such as how video efforts contributed to a 5% increase in conversions for a specific product line.
A well-designed dashboard can present these high-level takeaways instantly. You can build something similar to this sample from Google Analytics to display traffic sources for your video campaigns.
This kind of visual clearly shows which channels are driving the most viewers, helping you decide where to focus your marketing budget for the best return. It makes the impact of your video strategy easy for anyone to grasp. If you're looking for more ways to connect video directly to sales, you can explore some great ideas in our guide to product video marketing.
Scaling Video Analytics Across Multiple Campaigns
When you’re juggling dozens of video campaigns, that trusty spreadsheet you’ve been using starts to feel less like a tool and more like a ball and chain. Scaling your video marketing analytics without drowning in data requires moving beyond manual methods. Enterprise marketers manage this by creating standardized tracking protocols and frameworks for clear cross-campaign comparisons.
This means every video, no matter the platform, uses a consistent UTM structure. It also gets tagged by crucial details like the product line, target audience, and the campaign's main goal. This level of consistency is what allows you to benchmark performance meaningfully. For instance, you can directly compare the conversion rates of all your "Spring Collection Launch" videos across TikTok, YouTube, and Instagram to see which channel truly delivered the best ROI for that specific theme.
Creating a Scalable Reporting System
A scalable system is built on automation and smart dashboards. Instead of spending hours pulling numbers by hand, your goal should be to build reports that automatically update and show you trends as they happen. This frees you up to focus on strategy and creative thinking rather than mind-numbing data entry. To really scale your video efforts, you should look into options like how to automate your Instagram Reel campaigns, as their performance data will be a vital piece of your analytical puzzle.
Your reporting system should be designed to spotlight the outliers—both the wins and the losses. When a simple user-generated content (UGC) video suddenly starts outperforming your polished, high-budget studio ads, your system should flag it immediately. This is a golden insight that allows you to pivot your strategy and pour resources into what’s actually working. If you're looking to integrate more UGC, it’s worth checking out the top video UGC Shopify apps to see how they can feed into a more powerful, scaled analytics approach.
Your Video Analytics Implementation Roadmap
Turning theory into action is where your video marketing analytics journey really gets started. This isn't about giving you a huge, overwhelming to-do list. It’s about making smart, focused moves that will show you real results within the first month. Forget trying to track every single metric under the sun. Let's start with what actually connects to your Shopify store's success.
Your First 30-Day Plan
First things first, let's get your core tracking systems in order. The absolute priority is making sure your Google Analytics 4 is set up to capture e-commerce conversions. Paired with this, you need to use UTM parameters for every single video link you share. Just doing this one thing will give you instant clarity on which videos are driving traffic and, more importantly, which ones are leading to sales.
With that foundation in place, it's time to build a simple, manageable routine:
- Weekly Check-In (30 minutes): Block out a little time each week to look at your key numbers. Check the click-through rates from your big video channels (like YouTube or TikTok) and see how they translate to conversion rates in your Shopify dashboard. Are there any glaring issues or easy wins you can spot?
- Monthly Review (1 hour): This is where you go a bit deeper. Pull up your audience retention graphs. Where are people dropping off? Compare the performance of different video styles. Did that raw, UGC-style clip actually beat the polished product demo you spent weeks on? These are the insights that will shape your content strategy for the next month.
Setting Realistic Benchmarks
Don't expect your sales to triple overnight. A solid, realistic goal for your first month is simply to establish a reliable baseline. For instance, you could aim to figure out the average view-to-purchase rate for your top three videos. Success in month one isn't about hitting some arbitrary sales number; it’s about building a solid data foundation that will inform every decision you make from here on out.
Ready to put these insights into action? Add beautiful, shoppable videos to your Shopify store for free. With Moast, you can showcase your best content and turn viewers into customers in minutes.
Related content

Turn your social content into a revenue channel
Turn your TikToks and Reels into shoppable videos and boost conversions by 3.5x.