
.jpg)
Video commerce in 2026, in three numbers: shoppers on 5,842 Shopify stores running Moast watched 12.5 million on-site product videos in the past two months, sessions that engaged with those videos produced 14.2% of all checkouts, and video-influenced revenue reached $16.8 million. Below are 25 statistics on video commerce: 12 from Moast's own network data, 13 from named external sources, every one linked or documented.
Who we are and where these numbers come from: we build Moast, a Shopify-native shoppable video UGC app. The first 12 statistics are aggregates from the Moast network, measured in PostHog across 5,842 active Shopify stores between August 6 and October 5, 2026. They are network-level totals and medians; no individual store's data is identifiable. The remaining 13 come from external research, each attributed and linked to its source. Weigh our own numbers accordingly: they describe stores that already invested in shoppable video, not the average store.

Shoppable Video Performance on Real Shopify Stores (Moast Network Data)
1. Shoppers were served 59.4 million shoppable video impressions in two months. Across 5,842 stores, video widgets registered 59,384,487 impressions between August 6 and October 5, 2026. On-site video is not a niche placement anymore; on stores that run it, it is part of nearly every shopping session.
For scale, that is roughly 974,000 video impressions served every day, and it happened without a single live event: every one of these impressions is an always-on widget doing its job on a product page, collection page, or homepage.
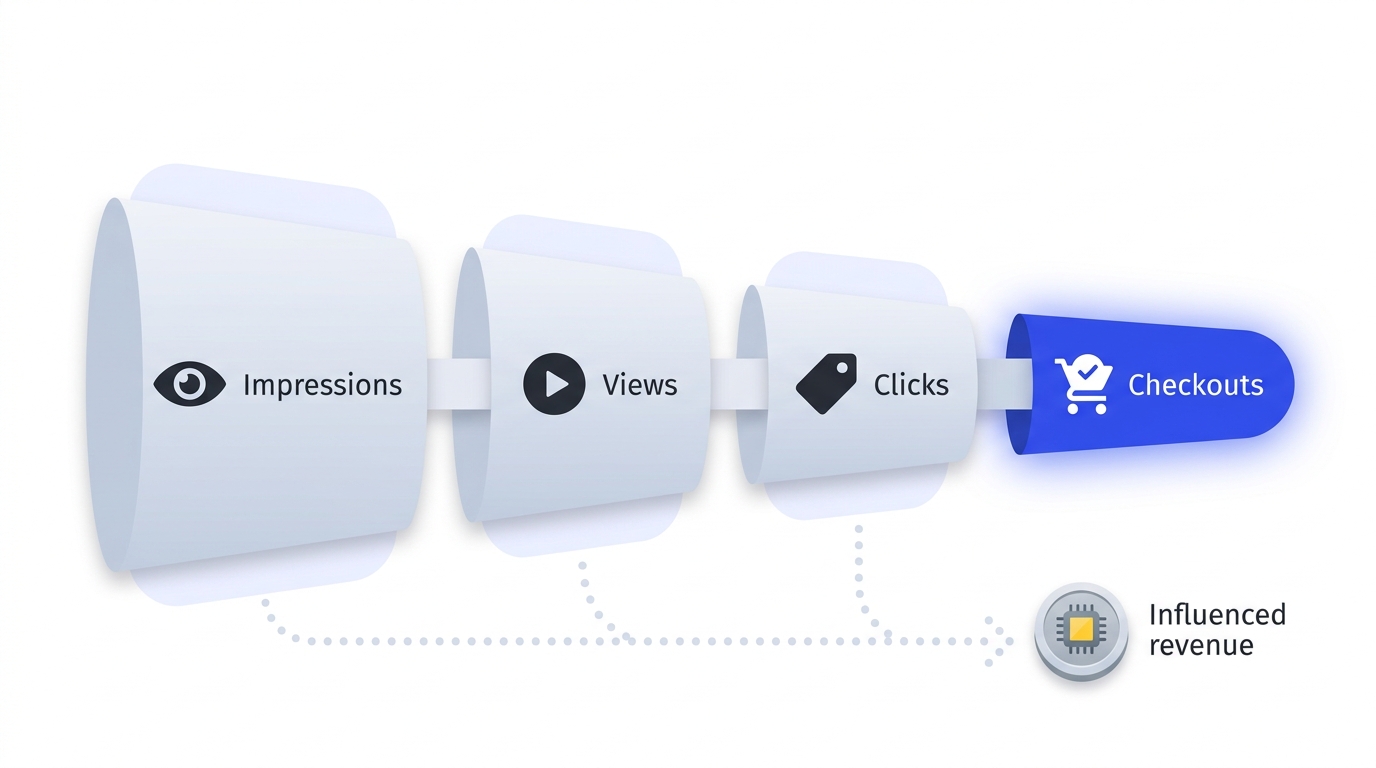
2. Those impressions turned into 12.5 million video views, about 205,000 per day. A view means a shopper actually watched a video on a product page, collection page, or homepage, not just scrolled past one.
3. 21% of video impressions become plays. The network-wide play rate was 21.0% (12,494,044 views on 59,384,487 impressions). Compare that with typical display ad click-through rates well under 1% and the appeal of on-site video as an attention format is obvious. A fifth of the shoppers who see a video choose to watch it, on pages where every other element is fighting for seconds of attention.
4. The median store converts 15.2% of impressions into plays; the top 10% of stores convert over 55%. Among the 1,528 stores with at least 1,000 impressions in the window, the median play rate was 15.2%, and the 90th percentile was 55.7%. Placement, thumbnail choice, and video quality create an almost 4x spread between typical and best, which is the clearest evidence we have that execution matters more than the format itself.
5. 1.6% of video views lead to a product click. Shoppers clicked a tagged product 199,573 times out of 12.5 million views. That sounds small until you remember these clicks happen inside content a shopper chose to watch; the median store's view-to-click rate was 0.9%, so stores with complete product tagging pull far ahead of the median.
6. Sessions that engaged with shoppable video produced 14.2% of all checkouts. The 5,842 stores completed 7,872,499 checkouts in the window, and 1,120,572 of them came from sessions that had engaged with a shoppable video. For a single on-site content format, owning one in seven checkouts is a serious share of revenue influence. We report this as correlation, not causation: video-engaged shoppers are often higher-intent to begin with. But a format that your most purchase-ready visitors consistently choose to engage with is exactly where proof belongs.
7. Video-influenced revenue reached $16.8 million in two months. Orders from video-engaged sessions totaled $16,514,865 in influenced sales, plus $284,094 in direct sales where the shopper bought the exact product straight from the video player.
8. Every 1,000 video views carried about $1,345 in influenced revenue. Divide the $16.8 million by 12,494 thousand views and you get the simplest planning number in this post: at network average, one incremental video view is worth roughly $1.35 of influenced sales. Run that math against your own traffic with our shoppable video ROI guide.

Where Merchant Video Actually Comes From (Moast Network Data)
9. Merchants added 80,051 videos to their stores in two months. That is roughly 1,300 new shoppable videos entering the network every day, and it says something important about 2026: the content bottleneck that used to stall video commerce programs is gone. The constraint merchants told us about in 2023, that producing video was expensive and slow, simply does not show up in 2026 behavior.
10. 79.5% of new store videos are imported from Instagram or TikTok, not uploaded. Of the 80,051 videos added, 63,622 came in through social imports, while direct uploads accounted for only 14.4%. Merchants are not producing separate content for their stores; they are reusing what already exists on social, which is exactly the pattern we recommend in our guide to building a video commerce strategy.
11. Instagram outnumbers TikTok 16 to 1 as a video source for Shopify stores. Merchants imported 59,890 videos from Instagram against 3,732 from TikTok, and 822 stores imported from Instagram against 260 from TikTok. TikTok dominates the cultural conversation, but when merchants pick the content that sells on their own storefronts, Instagram is still overwhelmingly the library they pull from.
12. Shoppable video adoption grew every month: impressions up 9.6%, stores up 4.5%. Comparing the two 30-day halves of our window, impressions rose from 28.3 million to 31.0 million, views grew 4.3%, and the number of stores actively serving shoppable video grew from 5,193 to 5,428. Quiet, compounding growth, measured in the middle of the slowest retail season.
The Video Marketing Backdrop
13. 91% of businesses use video as a marketing tool. Per Wyzowl's Video Marketing Statistics 2026 survey, video is effectively table stakes: nine in ten businesses produce it in some form.
14. 84% of consumers want to see more video from brands in 2026. The same Wyzowl survey finds demand still outruns supply. Shoppers are not tired of brand video; they are asking for more of it.
15. 85% of people say a video has convinced them to buy a product or service. Also per Wyzowl 2026. Video is not an awareness-only format; it closes.
16. 82% of marketers report good ROI from video, down from 93% a year earlier. Wyzowl's most interesting 2026 number is a decline. Our read: as video spreads everywhere, generic video stops standing out, and returns concentrate with the brands that put video where buying decisions happen and measure it properly, which is the entire argument for shoppable formats over decorative ones. A video that plays in a feed earns a view; a video that plays on a product page with a tagged product earns an attributable click and, often, an order.
Social and Live Commerce
17. US social commerce sales will pass $102 billion in 2026. eMarketer projects an 18% jump year over year, per Sprout Social's ecommerce trends roundup. The line between content and checkout keeps dissolving.
18. 82% of people use social media to discover and research products. Per Hostinger research cited in the same Sprout Social roundup. Discovery has moved to social; the question for merchants is whether the proof that converts, meaning the video, follows the shopper back to the product page.
19. 46% of shoppers prefer short-form video for product discovery and evaluation. Per Bazaarvoice, cited by Sprout Social. Nearly half of shoppers would rather evaluate your product through a 30-second vertical video than through photos and copy.
20. 23% of shoppers actively seek out product demo videos before buying. Also per Bazaarvoice via Sprout Social. One in four shoppers is literally searching for the content most product pages still do not have.
21. The global live commerce market reached an estimated $172.9 billion in 2025. Per Grand View Research, cited by Sprout Social. Live selling is the loudest corner of video commerce, though, as the next two numbers show, its gravity is still uneven across markets.
22. In China, livestream commerce hit $843.9 billion, or 19.2% of all retail ecommerce. Per eMarketer figures compiled in GetStream's livestream shopping statistics roundup. China remains the proof of how large video-native shopping can get.
23. Only 12% of US shoppers have bought through a livestream, and another 12% say they plan to. Per eMarketer, cited in the same GetStream roundup. The US gap with China is the opportunity: most American video commerce today happens asynchronously, through shoppable video on product pages rather than scheduled live events, which is why our own network numbers above matter for ordinary stores.
24. 76% of consumers who engaged with TikTok Shop went on to buy from a livestream. Per TikTok's own published figure, cited by Sprout Social. Treat platform-reported numbers with care, but the direction is consistent: shoppers who opt into video shopping convert at striking rates.
The Baseline Every Video Number Should Be Measured Against
25. The average Shopify store converts at 1.4%, and the top 20% convert above 3.2%. Per Littledata's Shopify benchmarks, which we break down in our guide to increasing Shopify conversion rate with video. This is the number that gives all 24 statistics above their meaning: when the average store converts 1.4% of visitors, a format that touches 14.2% of checkouts and carries $1,345 per 1,000 views is not a garnish. It is one of the few levers left that moves the whole funnel.
The 10 Numbers to Remember
StatisticFigureSourceVideo views on Moast stores, 2 months12.5 millionMoast network dataImpressions that become plays21%Moast network dataCheckouts from video-engaged sessions14.2%Moast network dataVideo-influenced revenue per 1,000 views$1,345Moast network dataStore videos imported from Instagram or TikTok79.5%Moast network dataConsumers convinced to buy by a video85%Wyzowl, 2026Shoppers preferring short-form video for discovery46%BazaarvoiceUS social commerce sales, 2026$102 billion+eMarketerChina livestream share of retail ecommerce19.2%eMarketerAverage Shopify conversion rate1.4%Littledata
Moast figures cover August 6 to October 5, 2026 across 5,842 active Shopify stores. External figures are current as of their linked sources, October 2026.
What These Numbers Mean for Your Store
Three conclusions fall out of the data.
The content problem is solved; the placement problem is not. Merchants added 80,000 videos in two months, four out of five pulled straight from social. If your product pages still have no video, the missing piece is not a videographer, it is a pipeline from the content you already have to the pages where buying happens. Our guides to increasing PDP revenue with shoppable video and Shopify social proof cover the mechanics.
The spread between median and best is the opportunity. The gap between a 15.2% median play rate and a 55.7% top-decile play rate is not luck. It is placement above the fold, honest thumbnails, complete product tagging, and videos that answer real buying questions. The brands in our shoppable video examples breakdown show what top-decile execution looks like.
Video commerce in the West is an on-site game. China's livestream numbers get the headlines, but with only 12% of US shoppers ever having bought from a livestream, the revenue for a typical Shopify brand sits in asynchronous shoppable video: always on, on your own pages, converting one shopper at a time. That is where 14.2% of checkouts and $16.8 million in influenced revenue came from in our data, with no live events required.
Methodology: How the Moast Numbers Were Computed
Definitions matter more than decimals in a statistics post, so here is exactly what each of our terms means. An impression is a shoppable video widget rendering in a shopper's viewport. A view is a shopper playing a video. A product click is a tap on a product tagged inside a video. A video-engaged session is a shopping session in which the shopper interacted with shoppable video before checking out. Influenced revenue is the order value from video-engaged sessions; direct revenue is the stricter subset where the shopper bought the exact product featured in the video they watched.
All figures are aggregates across 5,842 active stores measured in PostHog between August 6 and October 5, 2026, reported as network totals or per-store medians. We use medians rather than averages for per-store figures because a handful of very large stores would otherwise drag averages away from what a typical merchant should expect. Rate statistics are computed only on the 1,528 stores with at least 1,000 impressions in the window, so low-traffic noise does not distort them.
Two honest limitations. First, selection bias: these are stores that chose to invest in shoppable video, so they are not a random sample of Shopify merchants, and the checkout-share and revenue figures describe engaged adopters, not the platform average. Second, the window is two months in late summer and early fall; holiday-quarter numbers will look different, and we will publish updated figures as the dataset grows.
You are welcome to cite any statistic in this post. Attribute Moast network figures to "Moast" with a link to this page, and attribute external figures to their original named source.
Frequently Asked Questions
How many video commerce statistics in this post are original data?
Twelve of the 25 statistics are original, computed from aggregate Moast network data covering 5,842 active Shopify stores between August 6 and October 5, 2026, measured in PostHog. The other 13 are drawn from named external sources, including Wyzowl, eMarketer, Bazaarvoice, Grand View Research, and Littledata, each linked in the text. Nothing here is estimated or unattributed.
What is a good play rate for shoppable video?
Across the Moast network, 21% of shoppable video impressions become plays, the median store with meaningful traffic sits at 15.2%, and the top 10% of stores exceed 55%. If your on-site videos convert fewer than 15% of impressions into plays, placement and thumbnails are the first things to fix.
How much revenue does shoppable video actually drive?
In our two-month network window, sessions that engaged with shoppable video produced 14.2% of all checkouts and $16.8 million in influenced revenue, which works out to roughly $1,345 in influenced sales per 1,000 video views at network average. Individual results vary widely with traffic, catalog, and placement.
Do merchants need to produce new video content for their stores?
Mostly no. 79.5% of the videos merchants added to Moast stores in our window were imported from Instagram or TikTok rather than uploaded, with Instagram outnumbering TikTok 16 to 1 as a source. Repurposing existing social and customer content is the dominant, and fastest, path to a video-rich storefront.
Is livestream shopping worth it for US Shopify brands?
For most, not yet as a first move. Only 12% of US shoppers have ever bought through a livestream, per eMarketer, while on-site shoppable video works on every visit without a scheduled event. The sensible order for a typical Shopify brand is product-page video first, live events later if the audience justifies them.
Try Moast free with unlimited video views
Related reading: How to increase Shopify conversion rate with video · How to build a video commerce strategy · How to calculate the ROI of shoppable video
Related content
.jpg)


Turn your social content into a revenue channel
Turn your TikToks and Reels into shoppable videos and boost conversions by 3.5x.